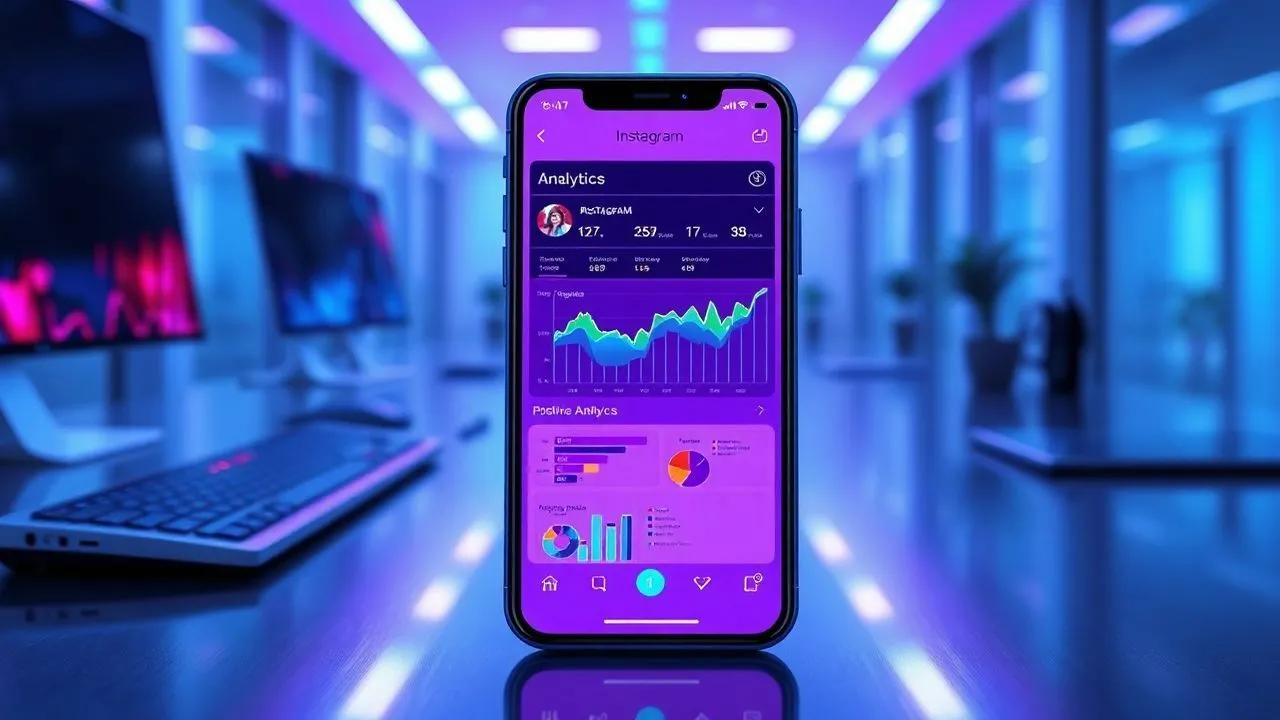
In the 2026 digital landscape, understanding statistical data is the only real way to emerge in an increasingly saturated market of multimedia content. Many users constantly wonder how to see Insights Instagram to transform a simple amateur profile into a professional asset capable of generating measured value, engagement and conversions. Instagram has evolved its interface in recent years, making analysis tools increasingly granular but, at the same time, complex for those who have no dimesticity with digital marketing metrics. Knowing how to interpret a visualization, distinguish between coverage and impressions, or understand exactly when your audience is online, represents the discrimination between those who publish “in the dark” and those who build an editorial strategy based on empirical evidence. In this context, the Insights are not simple numbers, but a compass fundamental to orientate between the algorithms that govern the visibility of content. Whether you are an emerging creator, a social media manager or the owner of a small business, mastering the app’s analytical section is the first step to optimize the time invested in creating content and maximize the return on communication investment, both in terms of time or advertising budget.
Preliminary requirements: activate your professional account
Transition from personal accounts to business or creator
To understand concretely how to see Insights Instagram, the first basic requirement is to own an account for professionals. The platform does not allow personal accounts to access advanced statistical data, for reasons related to privacy and to the distinction between ludic and commercial use. To do this, you must go to your profile settings, select the account type entry and choose between the Business or Creator mode. While the first is optimized for those who own physical activity or e-commerce, the second is designed for influencers, artists and public figures. Both options unlock full access to the professional dashboard, a control center where metrics are aggregated and displayed intuitively. It is important to note that this passage is free and can be reversed at any time, although the loss of data history is an immediate consequence of the return to a private or personal profile, a detail not to be underestimated during planning.
Dashboard configuration for professionals
Once the pass is done, the Dashboard for professionals will become the central point of reference. Within this section, Instagram aggregates the main performance indicators, allowing you to have an overview without having to navigate between the individual posts. The initial configuration requires you to connect, possibly, a Facebook page to unlock advanced features such as the Meta Business Suite, which extends analytics capabilities even on desktops. Within the dashboard, you can set specific goals and monitor weekly or monthly progress. This tool is essential because it provides personalized tips based on your account’s performance, indicating which types of content are performing better than the industry average. Many people looking for how to see Insights Instagram they often ignore that dashboard also offers access to official monetization tools and educational resources provided by Meta, making it a complete ecosystem for professional growth on the world’s most important photo social network.
- Access the Settings and Privacy of the application.
- Select the Account Type menu and tools.
- Please log in to an Account for professionals.
- Choose the category of goods or professional membership.
- Complete optional public profile configuration steps.
How to see Insights Instagram for individual posts
Interpretation of interaction metrics
Each single post published on the feed contains a mine of valuable information. To access this data, just open a specific content and tap on the View Insights item located immediately above the caption. The first screen that appears shows direct interactions: the number of I like, comments, sharings in stories or by direct message and, fundamental parameter for the algorithm of 2026, the number of saves. The saves indicate that the content has been considered so useful that it will be consulted again in the future, a very high quality signal. Analyze these metrics individually allows you to understand which format (carosello, single photo or video) generates more conversation or longer term interest. Often, a post with less like but many saves has a higher strategic value for the growth of the brand’s authority than a viral but ephemeral content, since it consolidates the relationship with the most faithful and interested audience.
Coverage data and origin of views
Going deeper into the analysis of individual posts, we find the data about coverage and impressions. The coverage indicates the unique number of accounts that saw the post, while impressions represent the total number of times that the post appeared on the user screen, including multiple views from the same account. A crucial aspect of how to see Insights Instagram lies in understanding where these people come from. Instagram segments impressions based on the source: From Home (current source), From Hashtags (new public), From Profile or From Other (explores, external sharing). If you notice that a significant percentage of views comes from the Explore section or the Hashtags, it means that your content exceeded the bubble of your current followers, reaching potential new followers. This data is vital to measure the effectiveness of your distribution strategy and to see if the tags used are relevant and performing for the target you want to intercept on the global market.
- Open the application and go to your professional profile.
- Select a specific post published in your feed.
- Tap the View Insights button placed under the image or video.
- Scroll up to see the full list of statistics.
- Compare cover data with interaction data to calculate the engagement rate.
Detailed analysis of Instagram Stories
Navigation and exit rates
Stories represent the pulsating heart of everyday interaction and require a different analytical approach than static posts. When you ask how to see Insights Instagram for your stories, you have to focus mainly on user navigation. By swipe upwards on an active story, or by accessing the archive for the past ones, you can see how many users have clicked on Next (by going through your next story), Back (reviewing the content), Next story (saving all your profile) or Exit (by closing the app or returning to the feed). A high number of “User” or “Next history” is an alarm signal: it indicates that the content is boring, too long or not pertinent. On the contrary, many touches on “Back” suggest that the content was interesting or contained text that required more time to be read, indicating a high level of attention from the viewer, an extremely positive data for loyalty.
Direct interaction and profile visits from Stories
In addition to navigation, stories are a very powerful tool to generate traffic to other sections of the profile or to external links. Insights clearly show how many people have visited your profile after seeing a specific story or how many have clicked on interactive stickers, such as polls, quizzes or adhesive link. Monitoring these actions is essential if you are conducting a sales campaign or if you want to increase traffic to an article in your blog. In this section, Instagram also reports the number of accounts reached and total impressions, just like for posts. However, the ephemeral nature of the stories makes this data even more urgent to analyze. Understanding what visual elements or call-to-action push users to interact more will allow you to sharpen your communication style, making your sequences of stories more and more immersive and less subject to public abandonment during sequential viewing.
General profile monitoring and statistics
Demographic analysis and follower growth
For a macroscopic view of your success, you should consult the General Insights of your profile. By accessing the dashboard and selecting Total Followers, you will enter a section dedicated to understanding your audience. Here you can see the net growth of followers in a given period, analyzing the balance between new followers and defollowers. But the real value lies in demographic data: main cities, countries, age groups and gender of your followers. This information is vital to see if you are attracting the right target for your goals. If, for example, you sell products for teenagers but your Insights show a predominantly over 50 audience, there is a clear misalignment in your content strategy. In addition, this section shows the days and times of greater activity of your followers, providing you with the exact indication of when to publish to obtain maximum initial visibility, a factor that in 2026 continues to heavily influence the initial algorithmic thrust of each post.
Coverage and accounts that have interacted
Another fundamental section of the General Insights is the overview of the total coverage and interactions of the account. This aggregate view allows you to see how many unique accounts you have reached in the last 7, 14, 30 or 90 days. Instagram further divides this data between followers and non-fosters, allowing you to evaluate your ability to pull out. The Account section that interacted, on the other hand, analyzes the deep involvement: who left comments, who sent messages or who interacted with the Reel. Studying the percentage change of this data over the previous period helps you to understand whether your strategy is improving or whether it needs corrections. If coverage increases but interactions decrease, you may be reaching the wrong people or publishing content that does not stimulate action. Learning how to see Insights Instagram holistically it means being able to connect these different points to form a coherent picture of its digital presence.
- Monitoring the net growth of daily and weekly followers.
- Analysis of geographical distribution to optimize time zones of publication.
- Check age bands to adapt voice tone (tone of voice).
- Study of peaks of hourly activity for content programming.
- Evaluation of the relationship between followers reached and non follower for virality.
Access Instagram statistics from PC and Web
Use of Instagram Web and native tools
Although Instagram is a mobile-first application, many professionals prefer to analyze data on a larger screen. Many people are looking for how to see Insights Instagram from computer to have greater convenience in compiling reports or spreadsheets. By accessing the Instagram official website through your browser and clicking on your profile, you can view the basic statistics for each single post by clicking on the View Insights button below the image. However, this web version is limited to the app and does not show, for example, detailed data of stories or complete demography of followers. It is a useful solution for quick control of the coverage of a post that has just been published, but for a professional and thorough analysis, it is necessary to rely on more advanced tools made available directly by Meta for business accounts, which allow much more structured and flexible data management for the expert user.
Meta Business Suite: the ultimate solution
The best way to manage and see Insights from PC is undoubtedly the Meta Business Suite. This free tool allows you to manage both the Instagram account and the linked Facebook page in one place. Within the Business Suite Analysis Tools (or Insights) section, you will find detailed reports that can be exported to PDF or CSV format, ideal for those who have to submit results to customers or superiors. Here the depth of data is maximum: you can compare the performance between different periods of time, analyze the trends of the most popular content and even monitor competitors. The Business Suite also offers an overview of the results of advertising, integrating organic data with paid data for a 360-degree view of return on investment. For anyone who does social media marketing seriously in 2026, the Business Suite represents the gold standard for statistical data analysis, far exceeding the limitations of the standard web interface of Instagram.
Data analysis is not a simple monitoring activity, but a continuous learning process that transforms numbers into far-sighted strategic decisions.
Advanced Strategies based on Insights data
Optimization of the editorial calendar
Once learned how to see Insights Instagram, the next step is the practical application of data to the creation of the editorial calendar. The analysis of the most performing post of the last month will show you what topics most resonate with your audience. If informational carousels get more systematically saved than single photos, you should prioritize that format. Similarly, if the Reel published on Tuesday evenings have double coverage compared to those of the weekend, your programming must reflect this evidence. It is not about blindly following numbers, but using them to test new ideas. For example, you may notice that a certain aesthetic or a particular type of narrative in stories leads to a higher rate of interaction: these are the “vittories” that are to be arranged in your editorial plan to ensure a constant and predictable growth over time.
Increase engagement through data
Engagement is not just a metric vanity, but the engine that pushes the algorithm to show your content to more people. Analyzing Insights, you can identify “triggers” that push users to comment or share. Maybe they are open questions in captions, or maybe it is the use of certain stickers in stories. An advanced trick is to observe the average viewing time of the videos: if most users leave the video after the first 3 seconds, it means that your “hook” (the initial hook) is not strong enough. Using this information to improve the first moments of your content can lead to a drastic increase in organic coverage. Ultimately, knowing how to analyze statistics means listening to what the audience is telling you without using words, allowing you to build an authentic and active community around your profile or your brand.
- Identify 5 content with more saves in the last 90 days.
- Analyzes common features (format, colors, tone, topic).
- Replicate successful patterns by introducing small variations to test new trends.
- Monitor the impact of changes on non follower coverage.
- Add the mix of content between educational, entertainment and promotional.
Frequently Asked Questions On How To See Insights Instagram
Why can't I see the Insights on my profile?
The main reason you can't see statistics is that you're probably using a personal account. Insights are an exclusive feature of Professional Profiles (Company or Creator). To solve, go to the settings, select “Type of accounts and tools” and complete the free transition to a professional profile. Once you do, you’ll start collecting data on new content, but you won’t see retroactive statistics for published posts when your account was still personal.
What does “Coperture” mean and what does it differ from “Impressions”?
The coverage refers to the total number of single unique accounts that have seen your content at least once. The impressions, however, count how many times in total your post appeared on the screens, regardless of whether it was seen several times by the same person. If a post has a cover of 100 and impressions of 150, it means that, on average, each user has displayed your content 1.5 times, an indicator of strong interest or return to the post.
Can I see who viewed my profile or posts?
No, for reasons of Instagram privacy does not allow you to see the specific identity (username) of people who view your profile or posts in the feed. You can only see aggregated and anonymous data such as total number of visits, geographical origin or age group. The only exception is Stories, where you can see the list of individual accounts that have displayed them within 48 hours of publication, after which the list disappears leaving room only to numerical data.
Does Insights also show Reel data?
Of course. Instagram devotes a very detailed section to Reel within the Insights. You can monitor the total number of reproductions, initial reproductions, total viewing time and average viewing time. This data is crucial to see if your short videos can hold users’ attention to the end or if there are specific moments when most people decide to scroll beyond the next video.
How long do statistical data remain available?
Usually, Instagram allows you to consult data within the app for a time span that reaches up to the last 90 days for most general metrics. However, for individual posts and Reel, statistics remain available forever until the content is deleted. If you need to analyze data on longer timeframes (e.g. an entire year), it is advisable to use the Meta Business Suite from PC, which offers a much larger and structured historian.
In conclusion, learning how to see Insights Instagram is not an optional activity for those who want to achieve tangible results in 2026. The ability to transform raw data into creative strategies is what distinguishes web marketing professionals from occasional users. Remember that numbers are just a means to better understand people who make up your community. Use this information with intelligence, constantly experiment and not be afraid to change course if data indicate a different direction than expected. Start today to analyze your profile and transform your way of communicating on Instagram into a success story based on facts and constant growth. If you have any doubts, consult the professional dashboard regularly and stay up to date on the latest news on the platform to never lose the competitive advantage that proper data analysis can offer you.


